How To Use Project Prioritization Matrices (Including Templates and Examples)

Deciding why to build something and then what to build are two of the biggest challenges for product managers no matter what size or stage of company you’re part of. But there’s also a third challenge: What to build first vs. what to build later?
What is project prioritization?
There are so many ways of approaching this - prioritization is a mix of art and science and can be every PM’s “Swiss Army Knife” of tools to apply to different situations involving different contexts and constraints.
No matter which way you decide to prioritize the work your team will focus on, it will boil down to value vs. effort.
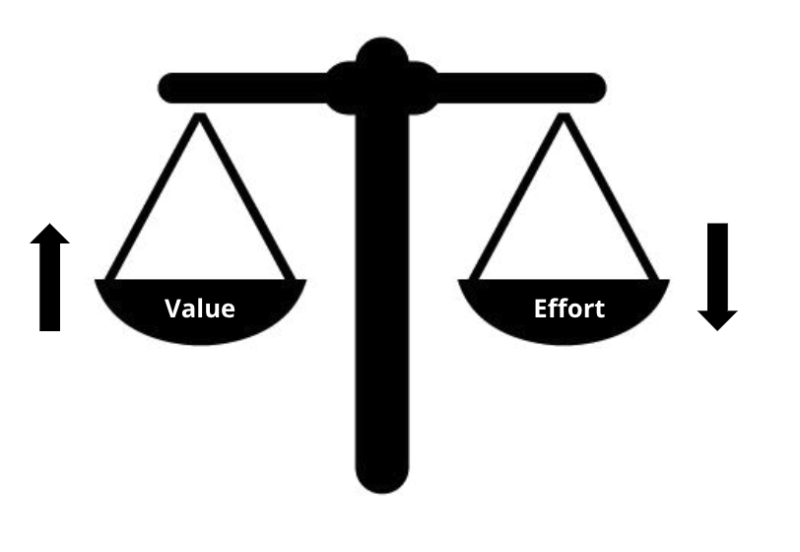
How much value do you get from the effort you are putting in?
If you’re working with a Now-Next-Later Roadmap, how do you know what work to put in each bucket?
There are many frameworks you can glean from and add to your PM toolkit.
Why is it helpful to use a prioritization framework?
Having a clear prioritization framework from the outset of product development helps greatly in:
Serving as the clear, objective rationale for why decisions were made to put X work in Y section of the roadmap vs. “the wild west” of gunslinging decisions
Providing transparency within the team and with your customers and outside stakeholders (Exhibit A: If no prioritization framework is in place and there’s a question about why specific work is being prioritized, you, as the PM, are always in the hot seat. I’ve seen this result in unnecessary meetings, confusion and arguments over Slack, and a whole lot of churn.)
Improving product decisions over time - the prioritization framework can be adapted as you learn more from the existing product prioritization, releases, and feedback gathered from your customers

What frameworks exist?
Value vs. Effort
Teams assign each feature a value - it could be business value (i.e. revenue), customer value (solves a major problem for customers that’s a huge friction point right now), or internal company value (i.e. addresses a massive amount of technical debt that the engineering team has been putting bandaids on and is taking their time away from more meaningful work). Then, each feature is assigned a cost - how much effort or lift it will take to accomplish. Teams can use a low-medium-high value scale, a red-yellow-green light system, or scoring (i.e. 1 = low value, 5 = high value).
Here’s a template you can use for value vs. effort prioritization.
Opportunity Prioritization
Popularized by Teresa Torres and her work in product discovery and opportunity prioritization is based on not prioritizing solutions or “features” but prioritizing opportunities for your team to focus on.
Rather than focusing on delivery output, the focus is on delivery outcomes for your customers and your business.
To put opportunity prioritization into practice, you can start by doing customer interviews and gathering a list of opportunity areas, based on what you learn from your conversations.
Opportunities could look like customer needs, pain points, desires, and wants. They are specific things you can act on to improve your customer’s life.
Once you’ve got a list of opportunities, you can group and frame these by mapping them to an opportunity-solution tree to help you visualize your best path to your desired outcome,

Excerpted from Teresa Torres’ Producttalk.org
Then, you can size each opportunity starting with the first level of opportunities in your tree based on your unique context (i.e. how many customers are impacted by it, how it impacts your position in the market, how it aligns with your product vision, etc.)
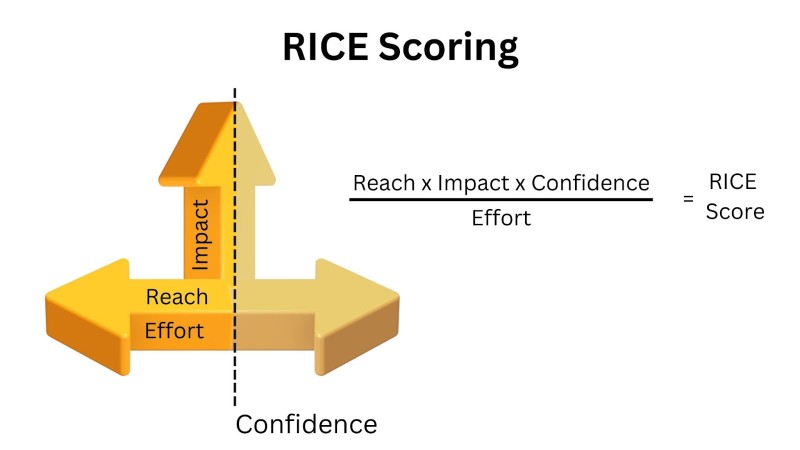
RICE
Rice was developed by Intercom and stands for:
Reach: An assessment of the number of people this feature will impact over a given time period (Read: A lot vs. not a lot)
Scoring → # of people or events/time (i.e. 5000 customers per quarter).
Impact: An assessment of how much individual users will be affected by the proposed feature.
Scoring → 3 = massive impact
2 = high impact
1 = medium impact
.5 = low impact
.25 = minimal impact
Confidence: An assessment of how confident you are re: the Reach and Impact scores (i.e. how many unknowns or blind spots are there? How much evidence do we have to base these numbers on?)
Scoring → 100% = high confidence
80% confidence = medium confidence
50% or lower = low confidence
Effort: How much work, lift, or energy will it take to bring the proposed feature to life? How much time will it take, approximately? How complex is it?
Scoring → Measured in “person months” (how much work can a single team member do in a month based on a typical schedule) i.e. Score of 2 = to complete this work it would take one person an estimated 2 months to complete.
Here’s a RICE prioritization template you can use to calculate your RICE score.
KANO
Pronounced “Kah-no”, this prioritization framework is named after Japanese researcher Noriaki Kano based on his paper, “Life Cycle and Creation of Attractive Quality”.
It focuses on how satisfied customers will be, due to the work you are aiming to implement vs. the cost to implement said work.
Kano is a great prioritization framework to use if you want to skew heavily towards putting the user first, but can be difficult to approach in a holistic way (i.e. Accounting for tech debt, infrastructure work, or features to improve business efficiency or operations)
The model is based on the following assumptions:
Customers’ Satisfaction with your product features depends on the level of functionality that is provided
Features can be classified into four categories;
You can determine how customers feel about a feature through a questionnaire.
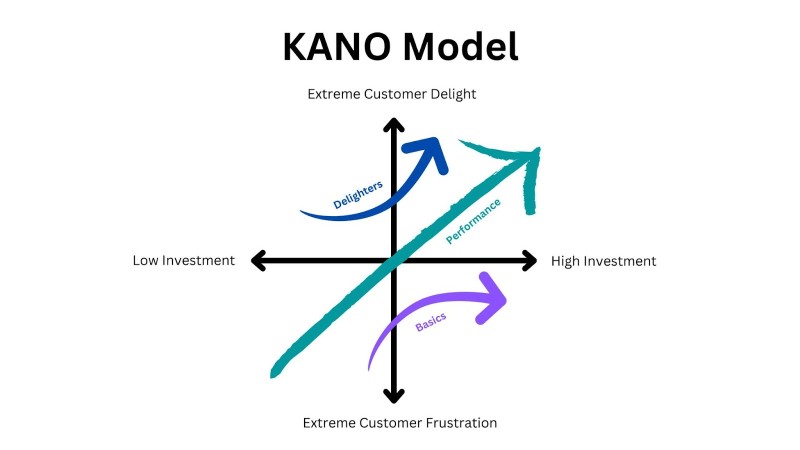
You can use the Kano model to assess which of these three buckets your product features fall into:
Bucket 1: MUST HAVES → Basic features that your users “just expect” (i.e. the ability to save a video game). If you’re missing these, your customers will be very frustrated!
Bucket 2: PERFORMANCE FEATURES → Features that improve product performance tangibly and increase customer satisfaction dramatically (more investment = more satisfaction) (i.e. website loading speed).
Bucket 3: DELIGHT FEATURES → Features that generate excitement and build on existing satisfaction. They typically don’t take huge investments but the investments made generate more and more delight for customers. (i.e. Spotify’s Wrapped “Year in Review” Feature)
Story Mapping
Story mapping is a prioritization framework that places emphasis on the customer’s experience above everything, and involves mapping out your product’s typical customer journey.
By first outlining the steps that a customer has to go through as they interact with your product, and then assigning user stories to each step, you can then assess which of these steps provides the greatest benefit to the customer and why to help you to prioritize what to focus on building first vs. next and so on.
For example, for a trip-booking app the prioritization of features based on story mapping could look something like this:
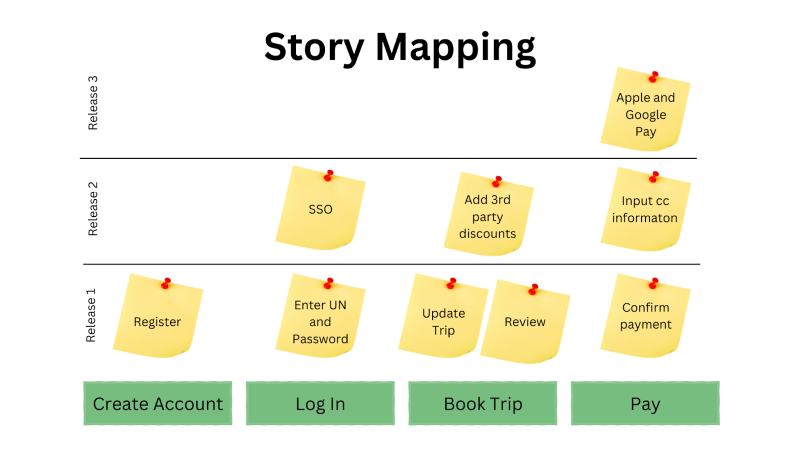
Similar to Kano, story mapping is a great prioritization framework to use if you want to skew heavily towards putting the user first and show this in a very visual and easy-to-understand way, but it can be challenging to incorporate items like tech debt, infrastructure work, and internal tools.
MoSCoW
This framework’s name is confusing as it really should be MSCW - the o’s are just fillers. It stands for:
Must-Have: Bare bones essentials to make your product “work”. What customers expect at minimum for the product to be functional.
Should-Have: Features that should be included but aren’t must-haves and are not as time-sensitive.
Could-Have: “Icing on the cake” features that aren’t essential but would add customer satisfaction if added later.
Won’t-Have: Out of scope for current version.
Mapping out which product features fall into each category can help you and your team to figure out where to focus efforts now vs. next vs. later with a clear understanding of why.
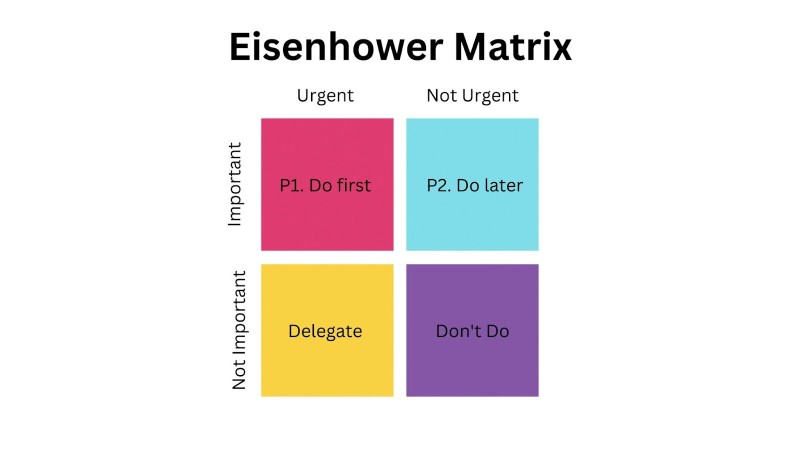
The Eisenhower Matrix
The Eisenhower Matrix is sometimes called the “Urgent-Important Matrix” and was developed by Dwight D. Eisenhower (the 34th U.S. President) to help him organize his decision-making and determine what to focus on.
This can be applied to product features as a way of understanding what items to include in your immediate roadmap, what to schedule in for later, what to delegate and what not to focus on to remove from your plate.
Opportunity Scoring
Opportunity Scoring is a way of understanding which of your product features customers think are important (i.e. are solving a critical job to be done for them) but that they are currently unhappy with or find disappointing. These areas represent opportunities for you to invest in, to improve customer satisfaction with your product (and potentially also increase revenue and your customer base).
Developed by Tony Ulwick, an innovation expert and founder of Strategyn, it is derived from outcome-driven-innovation (ODI) that begins with uncovering critical “jobs” customers are trying to execute when they are using your product.
To score opportunities, ask customers:
1. “How important is this feature or outcome to you?” (1 = low importance, 5 = high importance)
2. “How satisfied are you with how the product delivers this feature or outcome?” (1 = low satisfaction, 5 = high satisfaction)
You can use this prioritization approach to help your team gauge the return on investment (ROI) of working on specific features that are highlighted by these questions - ones that are important to customers and how unsatisfied they currently are with how they are delivered.
Buy a Feature
Buy a Feature is a prioritization framework that approaches each feature as something to assign a specific price to, that buyers (i.e. Internal Dogfooders, Alpha, or Beta testers), who are given a “shopping budget” can then “buy”.
The idea is that each “buyer” will need to prioritize what they spend their money on and prioritize the features that are most important to them as a result, which can give your team valuable insights as to how to prioritize your features, based on first-hand feedback under the given constraints.
To use this framework in practice:
Write down all of your initiatives so you can see what’s on the table.
Assign a price to each, based on how much effort it takes to implement.
Finally, give your “buyers” a set budget and let them go shopping.
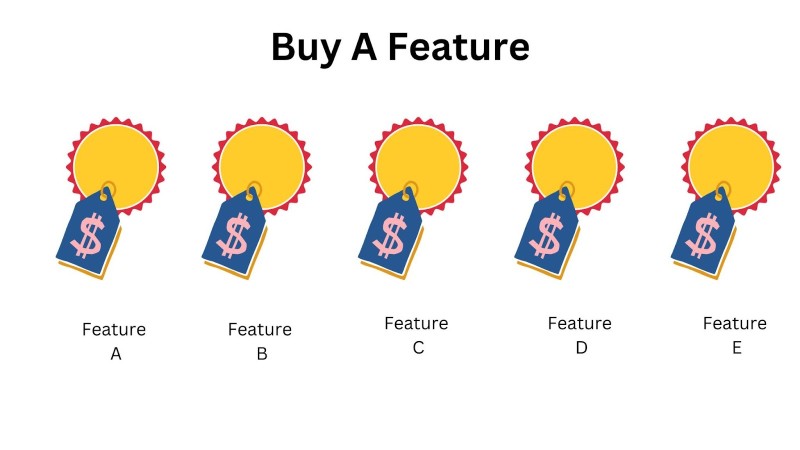
Similar to Kano and Story Mapping, this doesn’t typically incorporate initiatives like tech debt, infrastructure work, and internal tools, and involves careful planning to carry out well and ensure feedback is being captured adequately.
Prune the Product Tree
“Pruning the Product Tree” was an activity Luke Hohmann introduced in his book, “Innovation Games: Creating Breakthrough Products Through Collaborative Play” that helps teams imagine the future of their product visually.
It involves:
Gathering a group of 5-10 people - customers ideally but you can also use your internal team
Drawing the outline of a large tree (no leaves! Just the trunk and branches)
Providing a stack of blank post-it notes to represent the leaves of your tree, each with a different product idea or feature
Asking participants to add current product features to the trunk (as they’ve been there for the longest) and newer ideas to the branches - the tree represents product growth over time
Asking participants to remove any post-its from the tree that represent features they think should be eliminated from the product
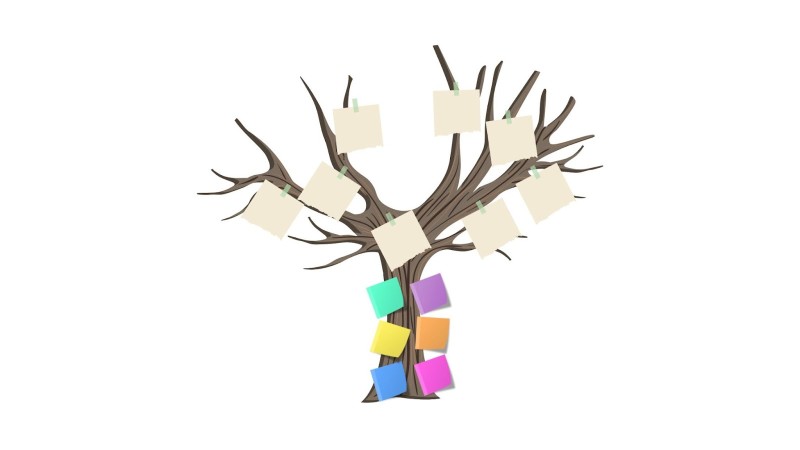
Encourage discussions around their decisions, and capture the reasons why they chose to add leaves or remove them.
This can give your team valuable insights to help you to prioritize your next product initiatives vs. ones you focus on later.
Cost of Delay
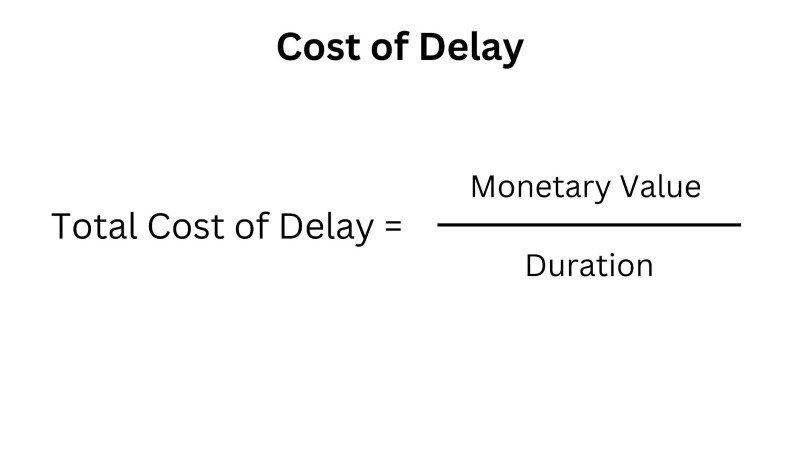
Cost of delay was developed by Joshua Arnold and is a way of communicating value and urgency.
Specifically, looking at the time that you wait between the time of idea conception to delivery (how long it takes to deliver value from end-to-end) and comparing that to its estimated value when out in the wild. If you can determine the value of your feature, and then work backwards to calculate the cost of delaying working on and launching this, you can estimate the monetary cost of delaying or not working on this feature.
If you can assess the cost of delay up front, it can often help you to make better decisions up front and put a price tag on not prioritizing certain product features.
For example, if a feature is estimated to be of a $200,000 per week value, the total cost of waiting 38 weeks to launch this feature and capitalize on this opportunity is over $8 million in revenue.
How should I use these frameworks?
There is no “right framework” as this depends on your unique context and constraints. My suggestion is to know them all well, and then apply them to your circumstances fully, or glean from them to create your own adapted version.
Take into account inputs including:
Desired Outcome
Team structure and skillset
Stage of product (i.e. brand new products going from 0 to 1 will require different prioritization than growth-stage or mature products)
Type of product (i.e. is it a technologically challenging product to build that involves a lot of unknowns? Or is the tech part fairly “known”?)
Market (are you first to market in a new market or entering an existing market with unique positioning?)
Company North Star
Product vision
Product pillars
What success looks like (for the company and for the product)
Whichever you choose, it’s crucial that you communicate this openly and frequently with your team (even include it in your Roadmap for context) so it’s transparent.
Lisa Zane

Read also


Prioritize with confidence
Experience the new way of doing product management
