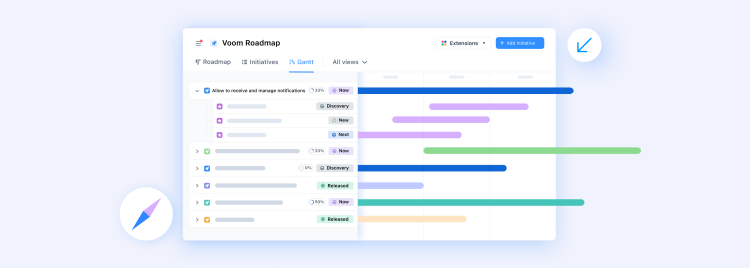
Gantt charts have become an indispensable part of successful project management. As projects grow increasingly complex and involve multiple teams, resources, and deadlines, Gantt charts serve as a visual aid that enables project managers to plan, monitor, and control various aspects of a project effectively.
In this blog post, we will look into Gantt charts and explore their significance in project management. We will cover their essential components, benefits, and best practices to help you gain a comprehensive understanding of how Gantt charts can streamline complex projects, track progress, manage deadlines, and foster collaboration among team members.

Project Management vs. Product Management
Before diving into Gantt charts, it's essential to clarify the difference between project management and product management, as they are often mistakenly used interchangeably.
Project management focuses on the planning, execution, and closure of a specific project within an organization. Project managers are responsible for overseeing the successful completion of a project, ensuring that all tasks are completed on time and within budget.
Product management, on the other hand, revolves around the strategy, direction, and continuous improvement of a product or product line. Product managers work closely with cross-functional teams to create products that meet customer needs, provide value, and drive business growth.
The primary distinction between project management and product management lies in their goals and scopes. While project management aims to deliver a unique, one-time outcome, product management focuses on a product's ongoing success and evolution.
Roadmaps vs Gantt Charts - What’s the difference?
The magic question - you know this was coming!
I could write an entire book about this (in fact, many great books like Roadmaps Relaunched have been written) - but it’s absolutely worth answering this question.
Roadmaps are there to set direction, intention, and drive alignment among team members, stakeholders, and customers. Roadmaps are generally more high level and less tactical than Gantt charts, and will focus on providing information around what, why, and for whom you’re focusing on any given initiative.
Gantt charts are typically used in project management to plan and track project tasks, dependencies, and timelines.
While Gantt charts may seem to be helpful in product management, the reality is they tend to push you more towards a build trap than outcome-focused success. Yes, deadlines are certainly important, and they will happen. Think industry regulations, conference deadlines, or even customer requirements that must be met. Having a roadmap that is not in a timeline form doesn’t mean you don’t get to have dates on it - it means that you’re focusing first on telling a story that will drive alignment. It also means that just because some items have dates, it doesn’t mean all items have dates.
So to recap:
Roadmaps
Focus on driving alignment and direction
Indicate what, why, and for whom
Does not focus on timelines, but can include key dates
Gantt charts
Offer key tactical knowledge
Focus is on the execution of the project
Looks at specific tasks and deadlines

Components of a Gantt Chart
A Gantt chart consists of several key components that help visualize a project's tasks, deadlines, and progress:
Task list: Lists all tasks involved in the project, often organized into groups or subgroups.
Timeline: Displays the project's duration, broken down into months, weeks, days, or years.
Dateline: A vertical line indicating the current date on the chart.
Bars: Represent individual tasks, showing their duration, start and end dates, and progress.
Milestones: Highlight significant events, decisions, or deliverables within the project.
Dependencies: Connect tasks that must be completed in a specific order.
Progress indicators: Show the percentage of completion for each task and may involve bar shading.
Assignments: Specify the person or team responsible for completing a task.
Benefits of using Gantt Charts in project management
Gantt charts offer numerous advantages in project management, contributing to their widespread adoption across various industries.
Gantt charts simplify complex projects by breaking them down into manageable tasks, enabling teams to better understand the project's scope and individual responsibilities, ensuring that everyone is on the same page.
In tracking task status and progress, Gantt charts excel with their visual representations of tasks and timelines. This allows project managers to easily monitor the project's progression and make necessary adjustments as needed, helping to keep the project on track.
Managing deadlines and milestones becomes more effective with Gantt charts. By displaying project deadlines and milestones prominently, teams can quickly identify potential bottlenecks or delays, allowing for proactive measures to be taken to address these issues.
Gantt charts also coordinate multiple teams and resources effectively. Assigning tasks to specific individuals or teams facilitates resource allocation and ensures that everyone is aware of their responsibilities. This clarity helps to prevent confusion and overlapping efforts.
Enhancing communication and collaboration within project teams is another advantage of Gantt charts. Their clear visual representation of the project's tasks, deadlines, and dependencies promotes transparency and fosters teamwork among project members. This collaborative environment can ultimately contribute to the overall success of the project.

When to use Gantt Charts
Yes, Gantt charts are rigid, but for good reason. They ensure everyone is on track and moving towards the same end goal. With that in mind, it’s important to note that a Gantt chart shouldn’t be used on its own. Pair it up with your product roadmap to present both the macro and micro views of the product’s direction, strategy, and execution. A Gantt chart, after all, is only as good as the direction it is provided.
Gantt charts are most helpful when a project requires more than a simple to-do list. Consider using a Gantt chart if your project:
Has a hard deadline.
Involves multiple people or teams that need coordination.
Requires a visual timeline from start to finish.
Contains tasks that must be completed in a specific order.
Involves team members working on multiple projects simultaneously.
Has tasks with clear time estimates.
How to create a Gantt Chart
Creating and implementing a Gantt chart requires the following steps:
Gathering essential project information: Before building a Gantt chart, you must have a clear understanding of the project's scope, tasks, and resource allocation.
Considering major deliverables, milestones, and dependencies: Identify the project's main deliverables, milestones that need to be achieved, and tasks that depend on one another for completion.
Assigning roles and resources: Allocate tasks to specific individuals or teams, ensuring that each team member knows their responsibilities and deadlines.
I took a stab at doing this with airfocus, and it was really simple.
The first thing I did was select the ‘product timeline’ template which already contained all of the epics and tasks in the backlog. From there all I had to do was select the ‘Gantt chart’ view - simple. It also really helped that all of these items already had timelines attached, so no need to redo them when switching views!
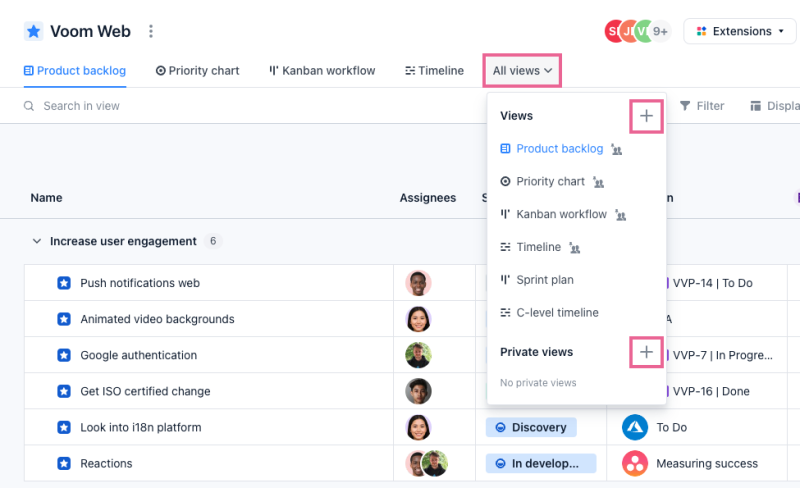
From here it’s really easy to see all items including their dependencies and current status, providing pretty good insight as to what’s going on.
It’s also handy that timelines can be adjusted just by using a drag/drop on the bar - I’ve found in the past this being a bit of a finicky feature for most timelines!
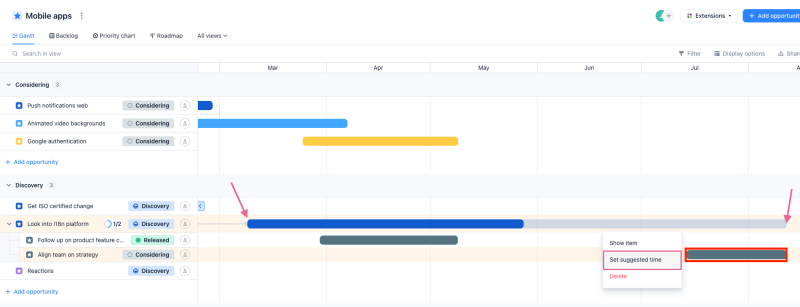
A simple and delightful feature is the ‘show item’ option - which allows you to see all of the item’s information without having to switch to another screen and then figure out where you were navigating prior to that on the timeline.
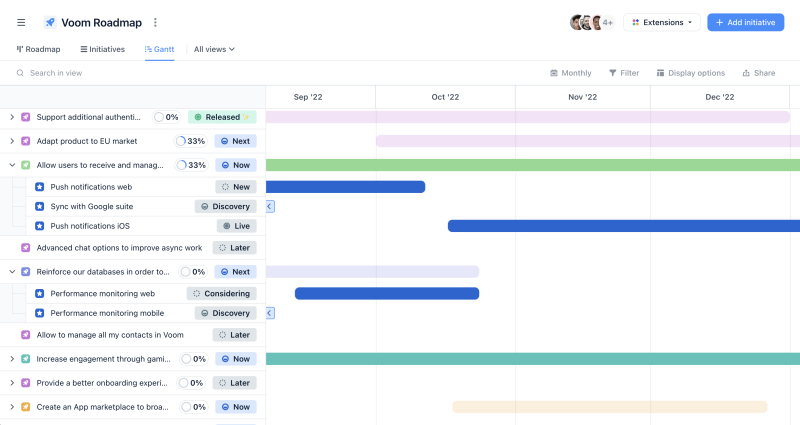
If you want more flexibility, airfocus certainly has it. I decided to change the view to sort by objective, and it did it without too much complication.
All in all, creating a Gantt chart was really easy, even more so when it took the information from the existing backlog to generate the view.
Conclusion
Gantt charts have proven to be a valuable project management tool, providing a visual representation of tasks, timelines, and dependencies that can streamline complex projects and improve collaboration among team members. By understanding the essential components of Gantt charts and implementing best practices, teams can effectively plan, monitor, and control projects, ensuring their successful completion.
While we may not all love having to adhere to strict deadlines, sometimes it’s necessary to ensure projects are moving forward and everyone is aligned with what, why, and how you’ll get there. Pairing Gantt charts with product roadmaps offers a holistic approach to managing projects, incorporating both strategic direction and tactical execution.

Andrea Saez

Read also


Experience the new way of doing product management
Experience the new way of doing product management


