Reducing product uncertainty through learning increases the likelihood of enhancing the business value. Product owners' mistakes occur when their decisions are not based on evidence. Thus, they often fail to build the right thing or optimize business outcomes due to human inherent flaws in making decisions.
The best way to make evidence-based decisions is to follow the data. However, the issue with using data is that you can easily become overwhelmed by it if you don't know what data to look at. Moreover, again human flaw prevents you from fully utilizing all of the insights data has to offer.
Analytics helps you to more precisely define the direction that the growing product should take, by measuring how well it is progressing toward the business goals. Making decisions is a critical step in the analytics process to turn data insights into real world actionable changes and performance enhancements.
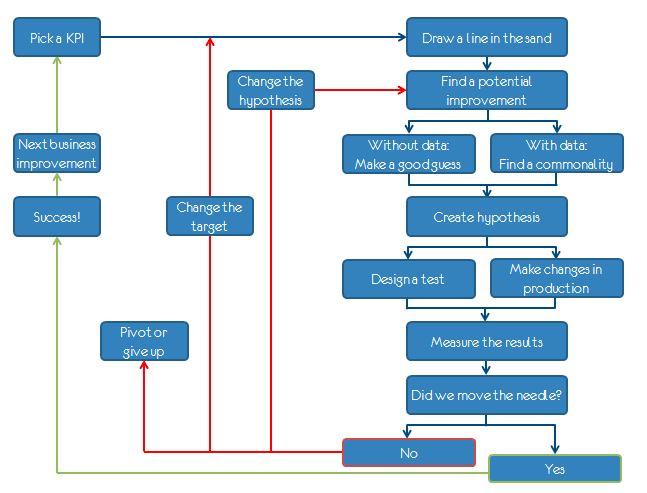
The Lean Analytics Cycle is a decision-making model that helps mitigate the influence of human error when making decisions. This model combines Data Analytics, Lean principles, and Customer Experience Research and Design to determine whether you are Building the Right Thing. (Asa)
What is the lean analytic cycle model?
To define Lean Analytics Cycle Model (LACM), it is necessary to understand the "Lean startup" approach first. Lean startup is a continuous, iterative improvement approach that provides the best and most cost-effective solution using analytics fundamentals.
This approach structures your progress and aids hone in on what you should be focusing on at any given time.
The Lean Startup, known as Build-Measure-Learn, involves the following steps:
Build something small that users can try.
Collect data about the experiences and behaviors.
Adjust your course accordingly.
LACM is under the umbrella of Lean startup, which applies to the second and third steps of the Build-Measure-Learn cycle.
It creates a sustainable way to pick metrics that matter, by tying them to fundamental business problems, creating hypotheses you can test, and driving change in the business from your learnings.

Kaushik distilled LACM flow into the following essential steps:
Figure out what to improve.
Form a hypothesis.
Create and run an experiment.
Measure and decide what to do.
Step 1. Figure out what to improve
Before adopting LACM, you should determine the following:
The most crucial aspects of your business are taken from the business model.
The highest priority business issue that needs short-term focus.
How to improve the issue.
If you don’t have data to decide on what to improve on and how, make a guess based on prior performance, the goals that were not achieved, or “what-if” scenarios to explore crucial metrics. If you do have data, you should look for commonalities that tell you what you should do.
With the help of Lean analytics, you identify “Metrics” that are relevant to your business. Then, One Metric that Matters (OMTM) should be linked to a particular Key performance Indicator (KPI) in order to measure your success.
Step 2. Form a hypothesis
In statistics, a hypothesis seeks to explain why something has happened, or what might happen, under specific circumstances. Therefore, it helps you understand how different variables relate to each other.
In the context of product development, a hypothesis is an assumption regarding a problem that your customers have, an unattended need of your customers, or a risk associated with your business model or strategy that serves as the basis for initiating an investigation. (Chiva��).
The hypothesis is usually concealed in a problem statement, and it may also be a statement of what you expect to happen in the experiment.
Using data that is not properly analyzed or does not take into account the big picture of the business will be harmful. As a result, to develop a hypothesis, you need to be data-informed rather than data-driven.
If you lack the data to understand the market, utilize techniques like surveys, questionnaires, etc., to support your hypothesis. Otherwise, you can imitate the successful ideas of your rivals or get inspiration from best practices.
An example of a hypothesis template is:
“If [this idea] happens, we believe [this business outcome] will happen”. (Panagiotakopoulos)
You might have several hypotheses, but you can't test them all. As a result, you must identify the high risk and high value ones to test. The hypothesis prioritization canvas is a facilitation tool made by (Gothelf).
Step 3. Create an experiment
The hypothesis has to be tactical, and testable to frame ideas in a way that encourages experimentation, learning, and discovery. Indeed, with designing an experiment, you can validate or refute your hypothesis.
To get started with an experiment, you ought to be aware of whose behavior you're going to change, what it is you want them to do, and why they would listen to you. The following is how your hypothesis should be translated into an experiment:
“We believe [this business outcome] will be achieved if [these users/customers] attain [a benefit] with [this solution/feature/idea]”. (Gothelf)
Before conducting the experiments, the following points should be taken into account:
Restrict the target audience to cut down on costs and trial risk.
Decide which experiment should be used for learning activities and which for building.
Prioritize the experiments.
Step 4. Measure and decide what to do
The last step is to measure and examine the result of your experiment to validate your presumptions about the impact of the design or feature. If your experiment worked, you can proceed to the next one. Otherwise, revisit your hypothesis and come up with a new one based on what you have discovered.
Some of the things to look for when measuring the outcomes include:
Was the experiment carried out successfully?
Did the experiment fail?
Is the experiment progressing but not approaching the intended goal?
When conducting Lean Analytics, you should take the following factors into account:
To validate an assumption made in a hypothesis, you can perform hypothesis testing. The key component of hypothesis testing is the isolation of user experience variables to determine the success or failure of changes.
There are two sorts of hypotheses used in hypothesis testing.
The Alternative hypothesis, which is being tested, expresses a correlation between variables.
The Null hypothesis demonstrates that there’s no statistical relationship between the variables being tested.
Imagine a company that wants to know whether lowering the cost of its services can entice more customers to generate more than $12 million in monthly revenue. In this case, an alternative and null hypothesis are :
Alternative hypothesis: If we reduce the cost of the flagship service by 5%, sales will make more than $12 million in the next month.
Null hypothesis: revenues from the $12 million wouldn’t change or might even fall.
3. It is good to have a sample data set to do hypothesis testing. Sampling guarantees that the variables we chose for the test are not biased.
4. To understand how confident you are in the test results, you need to identify a p-value. The p-value in statistics represents the likelihood that the Null hypothesis is true.
5. Using the appropriate testing method is crucial when the time comes to test your experiment. There are several types of techniques that can be employed, including A/B testing, multivariate testing, before-and-after testing, time-based on/off testing, etc. (Raghavendra )
6. It is essential to use statistical power and significance to prove that the product change had a genuine influence rather than a fortuitous one.
Difference between metrics and KPIs
If you want to use lean analytics, you must find good metrics and key performance indicators (KPIs). Although some people use the terms KPI and metrics interchangeably, they aren't the same.
KPI, also known as performance metrics, is a quantitative indicator that measures the performance or progress of the identified business goals. Thinking about how you want to measure your success and how you want to get there is the key to finding KPI.
For example, if the business objective is to raise revenue by 15% by the end of the year, Your KPI may be monthly upselling success rate, customer acquisition cost, customer retention rate, etc.
On the other hand, metrics are the measurements you monitor as part of your business activity to determine how well that activity worked and how things are correlated. For example, the average click through rate on email marketing.
Metrics help in identifying the KPIs that are most crucial to an organization's success and demonstrate how they relate to one another. Therefore, to meet the KPI, you must examine the relevant metrics.
Eventually, every KPI is a metric but not every metric is a KPI.
The One Metrics That Matters (OMTM) is a crucial tool for choosing the right KPIs tailored to your solution and pinned objectives. OMTM is all about finding the right thing to track in order to gauge growth and success at the right time, based on:
a) the current state of the business, b) the type of business, and c) the industry in which you operate.
What makes a good metric?
Before defining a good metric, we need to know that there are two categories of metrics: Qualitative & Quantitative.
Qualitative metrics have direct contact with your customers. These metrics look at a value beyond clear-cut numbers (e.g., brand credibility, industry influence).
Quantitative are direct indicators of growth represented in numerical values (e.g., revenue generated, social media followers).
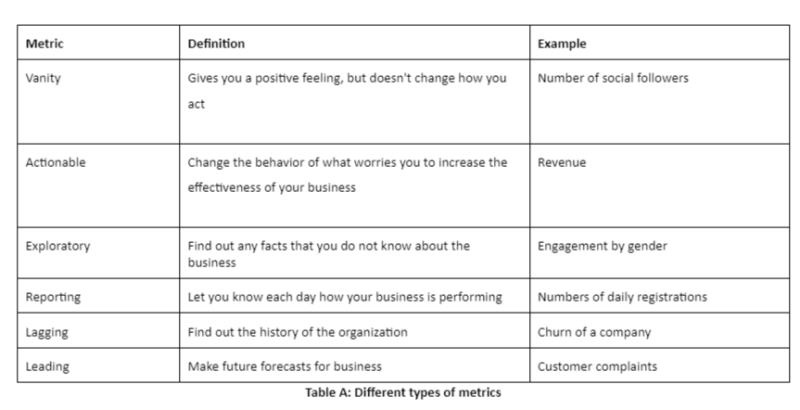
Table A lists other types of metrics that may fall under the quantitative and qualitative categories.

The above metrics tell you which one may work out well for you based on your business goals. However, a good metric is beyond just choosing a type. It must be:
Relevant: aligned with business goals.
Comparable: has the ability to compare changes, track progress and demonstrate performance over specific periods of time.
Understandable: does not require deeper explanations; should not be difficult to evaluate.
Adaptable: changes the same way that the business changes. If the metric is moving, but you do not know why it is not a good metric.
Rate / Ratio: You should never work with absolute numbers when you are working with metrics.
Finally, to determine the appropriate metric, you must take into account the details of your business model, the stage of the product life cycle you are currently in, the issue you are aiming to solve, and your analytics model.
Data relations in analytics
While discussing analytics, understanding the relationship between the data is crucial. However, not all data correlations are always obvious. The various forms of data relationships are as follows:
Correlational: Two data points behave similarly as a result of another data point. In other words, A is related to B, but both are actually caused by C. This type of relationship can help forecast the events.
Casual: Two data points act similarly because one of them changes the other. Thus, A causes outcome B. It can help you affect the future.
The opposite is true: B actually causes A.
Another variable involved: A does cause B as long as D happens.
Chain reaction: A causes E, which leads E to cause B. However, the observation is that A causes B.
To understand the relationship between data, you must perform the following processes:
Find a correlation to determine the strength of the relationship between two variables.
Test causality.
Optimize causal factor.
Lean analytics stages
Lean analytics defines the following product life cycles' stage for successful software product development:
Empathy: determining a real-world solution to an issue that people will pay for.
Stickiness: building the right product to keep users around and see if they will be engaged.
Virality: growing the user base organically and artificially.
Revenue: establishing a sustainable, scalable business model with the right margins in a healthy ecosystem.
Scale: growing the business by increasing acquisition and retention rates while maintaining profitability.
The stages of growth provide an intriguing framework for thinking since they can help with alignment and focus. If your product hasn’t been tested in the lower stage (stickiness) before moving on to the upper stage (scalability) , you may see a quick increase in the number of users that drops equally fast.
In order to grow your product, all of the stakeholders should agree on the stage the product is currently in. Then, the objective for the current stage should be determined. Additionally, KPIs and some quantitative target metrics should be defined to signal when the product has finished one stage and is ready to move to another. Finally, at each stage, the delivery team focuses on addressing a particular set of risks, by tracking the right measurements.
The Hook-Model and Lean analytics stages are combined in a visualization tool known as "Lean analytics canvas," which helps to create products that users will stick with. (Monnikendam)
Below are the definitions of Hook-model steps:
Trigger: What gets the user to the product?
Action: What is the simplest behavior in anticipation of reward?
Variable reward: Is the user satisfied with what they get? Or do they want more?
Investment: What is “the bit of work” done by the customer to increase the likelihood of returning?
Case study: Social mobile app
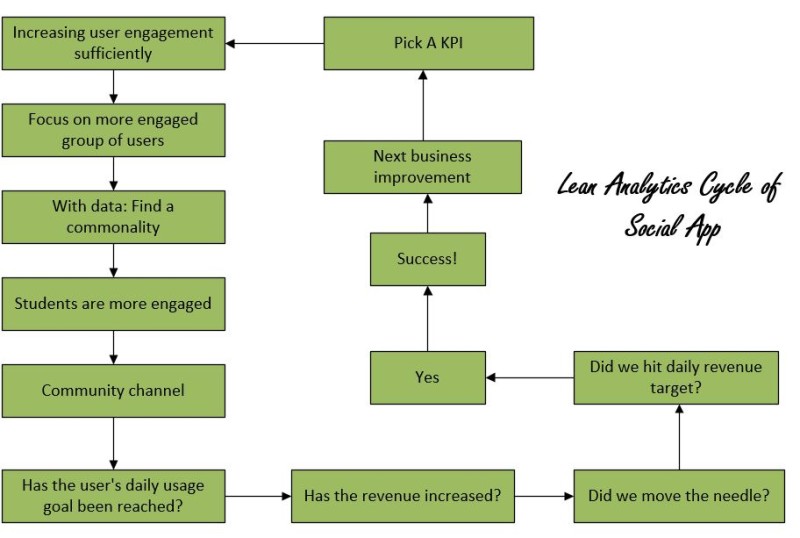
Let's walk through a real-world case study to better understand how to use the Lean Analytics cycle model.
Let's imagine, you plan to launch a new version of a social mobile App to increase average revenue per user (ARPU) by 10% compared to the previous version. This product is currently in the "empathy" stage of Lean Analytics and is aiming to reach the "stickiness" stage. Therefore, growing user engagement will be a huge concern.
The following KPIs and OMTM are defined as follows:
KPI: revenue growth (average revenue generated during one day divided by the average revenue generated during a subsequent day per user)
OMTM: percent daily use in last 24 hours (daily user engagement)
Current level: only 30% of people who have signed up are actively engaged in a day
Target: increase the number of engaged users by 15 %
Then, I answered the following inquiries:
Which users currently need to be engaged more? The students
What do engaged users have in common? Discuss and share the different scientific subjects.
What do you want them to do?
Messages to one another were, on average, 50% longer.
80 % more likely to attach a picture to a post they wrote.
Engage in a threaded conversation.
30 % more clicks on news feed items.
25 % more clicks on notifications.
Invite new users.
Why do they do it? interaction and knowledge exchange with others is valuable and appealing.

There are numerous hypotheses that may help to engage more students. Take into account the following as one of those hypotheses:
“If user engagement increases 15 % per day, we believe that the average revenue rate per user will be 10 % higher.”
The hypothesis’ experiment could be:
“We believe a 10% increase in average revenue rate per user will be attained if 15% more students engage with the App in a day as a result of joining the community channel.”
A day after the communities’ channel feature was released in the new version. You want to know if this feature has an impact on user engagement. Moreover, you want to prove this kind of engagement has a direct and positive impact on ARPU, as expected.
I don’t have enough information to draw any conclusions on whether user engagement through communities causes revenue. I only know these two variables (engagement, and revenue) are correlated and maybe caused by some other unknown factor.
Once the correlation has been discovered, a test should be run to control the other variables and measure the difference.
If you have already collected historical data, hypothesis testing can be done to determine whether a relationship between two variables is valid. Hence, the following Null and Alternative hypotheses (H0 and H1 , respectively) should be defined:
H1: if student engagement increases by 15% per day through the community channel, then the percent of average revenue per user increases by 10 %.
H0: There is no relationship between user engagement through the community channel and increasing average revenue.
If you can reject the null hypothesis (H0) by statistical p-value, significance, and confidence calculation, then you can conclude that there is a causal relationship between user engagement and revenue.
Moreover, A/B testing makes it possible to determine whether there are causal relationships. Hence, you should create two equally-sized cohorts with randomly selected users.
Users in cohort A are the students who have used the community channel, whereas students who have not are in cohort B. The experiment can be carried out with the 10% of students split into two cohorts in a month.
You must take out all potential confounding factors before arguing that joining the community results in higher engagement rates. For example, don't allow users to access an alternate path, which would ultimately have an impact on user engagement.
When the test is over, you can look at the results and compare the metrics of cohorts A and B to each other. The better you get at spotting the true causation in your product, the better you can prioritize your product investments and increase revenue.
Bibliography
Croll Alistair, Yoskovitz Benjamin Lean Analytics: use data to build a better startup faster.s.l. O'REILLY,2013
Asa Tania Decision-making models.[Online][Cited: 11 04 2022] https://www.sweetspot.com/en/2013/10/17/decision-making-models/.
Chiva Gerard Lean Product Management: How to develop successful digital products.Barcelona,AKTIA Solutions,2019.
Gothelf Jeff The hypothesis prioritization canvas.[Online][Cited: 11 08 2022] https://jeffgothelf.com/blog/the-hypothesis-prioritization-canvas/.
Kaushik Avinash The Lean Analytics Cycle: Metrics > Hypothesis > Experiment > Act. [Online][Cited: 11 30 2022.] https://www.kaushik.net/avinash/lean-analytics-cycle-metrics-hypothesis-experiment-act/
Monnikendam Markus Implementing Lean Analytics With Lizard Global.[Online][Cited: 11 08 2022.] https://lizard.global/blog/impementing-lean-analytics-with-lizard-global
Panagiotakopoulos Foti Lean Analytics. [Online][Cited: 11 08 2022.] https://www.growthmentor.com/glossary/lean-analytics/.
Kumara Raghavendra Shipping Your Product in Iterations: A Guide to Hypothesis Testing.[Online][Cited: 11 10 2022.] https://www.toptal.com/product-managers/data/product-hypothesis-testing/.

Behzad Nazarbakhsh

Read also
Experience the new way of doing product management


