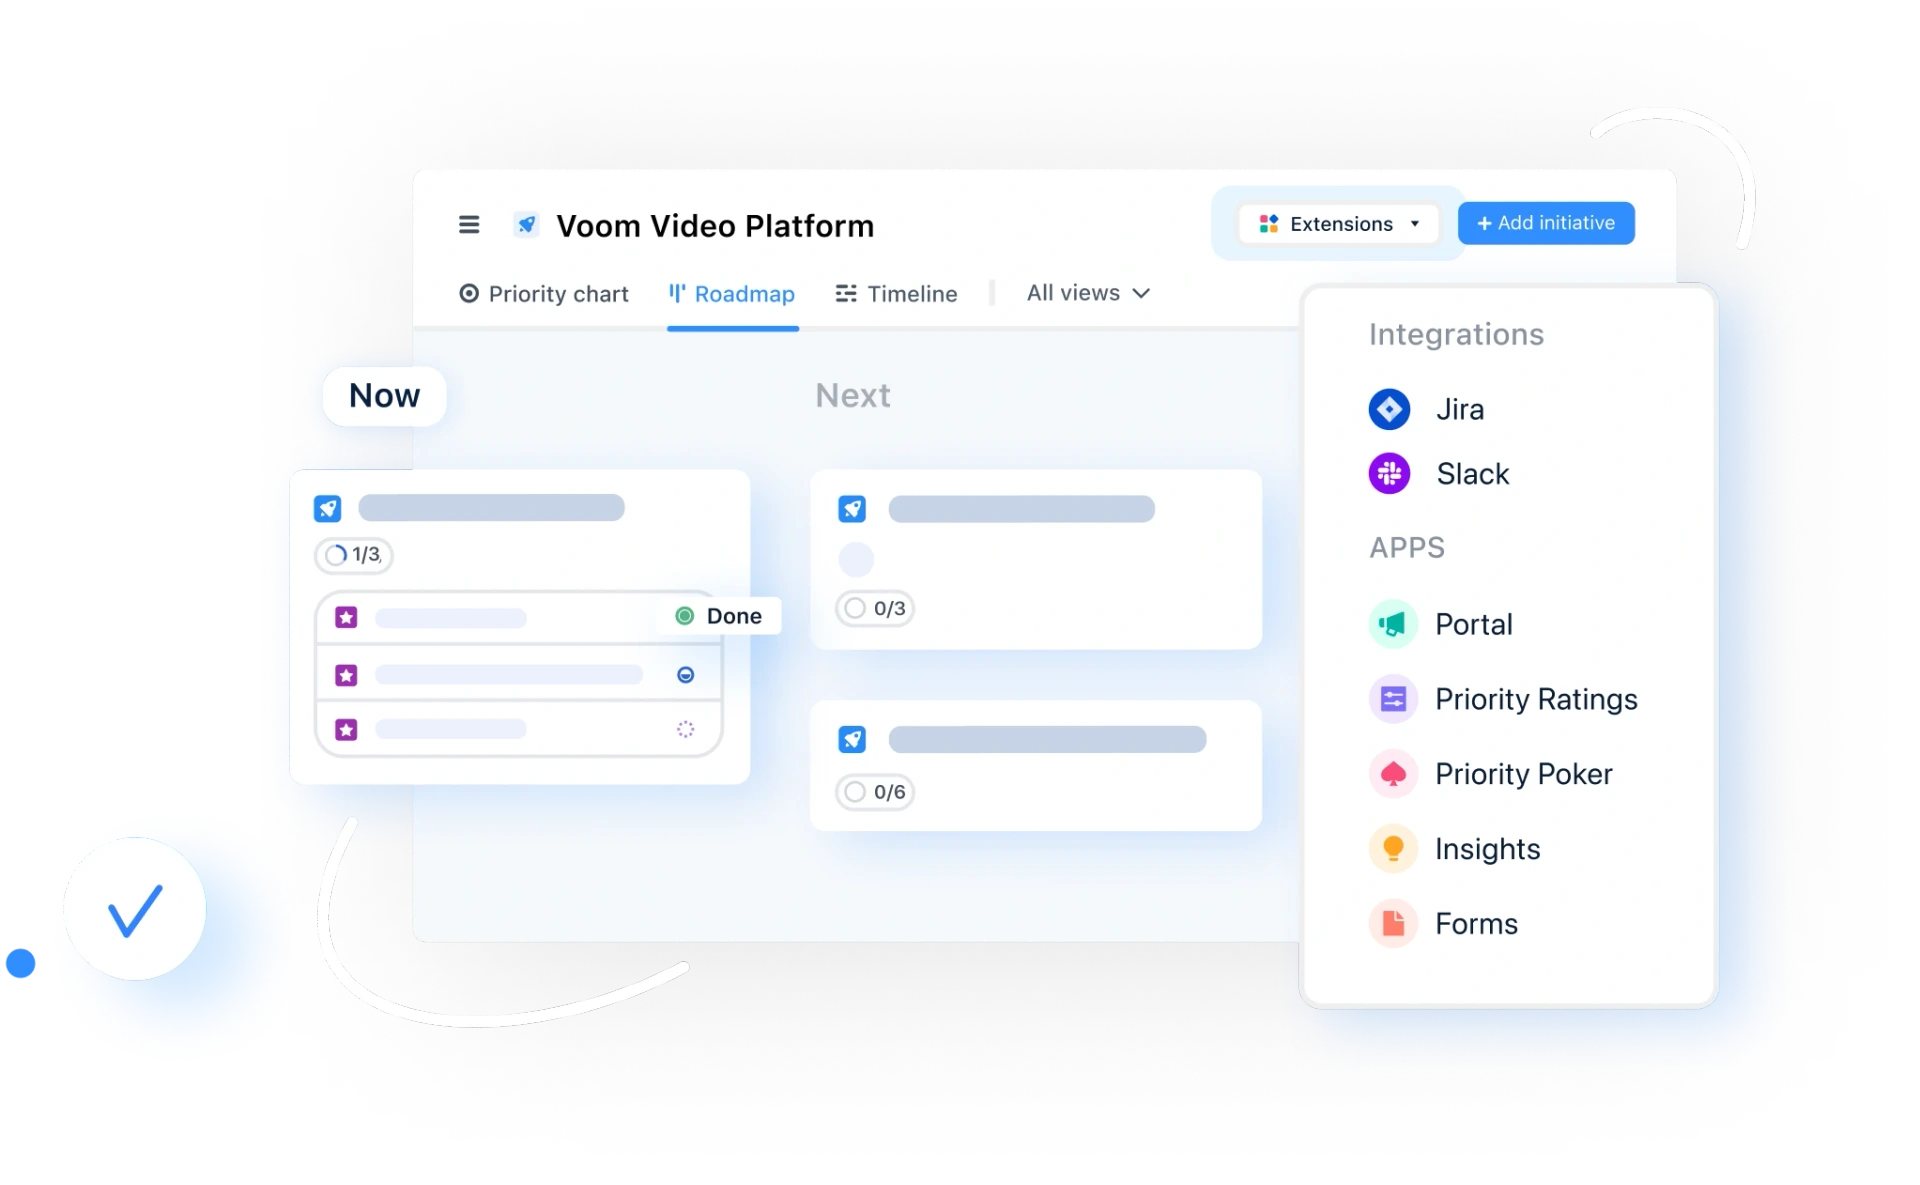
We often get asked a simple question: What is the most effective way to create a product roadmap? To answer this, we first need to take a step back and understand why roadmaps are vital to every product management team. Whether you are a large company with multiple products on your portfolio or a start-up with just one developing product, roadmaps act like the blueprint to your vision.
Building a great product is hard enough. But building a great product without a plan and a vision to dynamically cater to the various business requirements is next to impossible.
Over the last year, we have onboarded thousands of users to airfocus and in the process, also conducted extensive interviews with product managers. Our research on the best practices and the pain points regarding roadmapping reveals one key insight:
The best technique to create a product roadmap is to base it on objective priorities!
People end up focusing so much on making their roadmaps visually appealing and presentation-ready that they push prioritization to the end of the process, thinking it is counterintuitive to do at the outset or in between.
Best practices suggest that you should start roadmapping by first prioritizing all your projects, features, and initiatives and then moving your attention to the visualizations.
Why? Simply because your roadmap is like the North Star, guiding you on what gets done, by whom, and when. Ensuring that everyone works on the right stuff is going to save you a lot of time, effort, and money. 80% of your job is done if you know what your priorities are and why.
No, don't just take our word for it. Even the most seasoned product managers repeatedly state that the moment you note down your core strategic drivers and resulting priorities, you give clarity to everyone on the team and get them aligned on your vision.
With this in mind, here's a simple 3 step guide to help you create a priority-based roadmap:
1. Develop a prioritization model
This might sound like a loaded term. But really, it is as simple as defining your strategic value and cost drivers that you want to use to rate your features and projects against. It's about defining a system that gets you an objective base to make decisions.
Let's look at an example. Say you are developing a web app and need to create a product roadmap to provide guidance for the upcoming six months. To do this, you might use revenue increase, customer value, and user experience as your value criteria. On the cost side, you can keep it simple and only look at the number of days you need to develop a new feature.
Next, you can use a weighted scoring model to rate your features and projects against one another by assigning ratings across all your value and cost drivers for each initiative. Depending on your needs, you could also deploy different rating scales per criteria like monetary value, percentages, 0 to 10 scales, or even t-shirt sizes (S/M/L sizes).
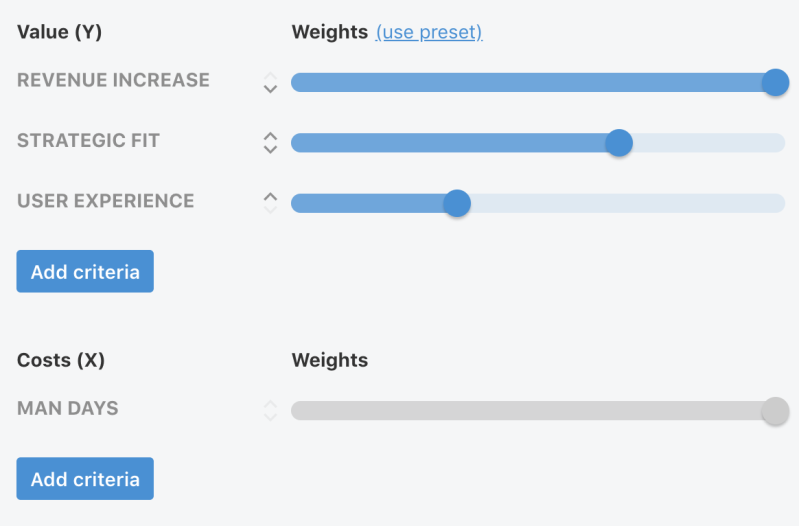
This will help you arrive at a much more systematically derived set of priorities. To understand this in further detail, you can check out our other blog on how to master prioritization by using a scoring model to uniquely fit your product requirements. You could also sign up for airfocus and set all that up in an easy-to-use web app.
While developing that prioritization model, make sure to always analyze your current situation: Ask yourself what your focus is right now? What is your timeline? What are the challenges and opportunities for you at present? Are there any dependencies or fallbacks? What are your upcoming releases? Analyzing your current situation in this way helps you learn about the state of things so that your model is inclusive and realistic.
2. Prioritize what to do
This is a crucial step where you can aggregate all of your feature requirements and ideas and rate them against the value and cost drivers defined in the first step.
Citing our previous example, you would provide answers to the following questions. How likely is it that the ideas and features that you defined in step 1 will return cash? Do they provide value to your users? How do they help improve the overall user experience? Moreover, how many days will you need to complete them?

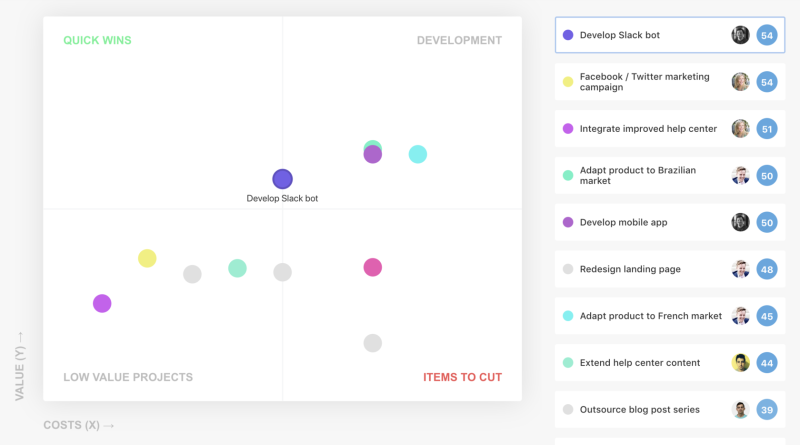
Et voila! Now that you're done with the ratings, you have a prioritized list of your strategic features and projects. This lets you spot your low-hanging fruits and won't dos or the near-term goals and also get an overview of the projects in the pipeline.
3. Create your product roadmap
The last step is to create a roadmap that is actually based on objective priorities. This means making decisions on when to work on which priority as well as who should be responsible for what.
In a perfect world, you would work on the highest scored priority from step 2. Unfortunately, due to dependencies, resource availability, and other external factors, this is usually not how it works, so you might need to take some tricky trade-off decisions here.
There is often constant pressure from sales, partners, and other stakeholders to change priorities and squeeze stuff into your roadmap. This is when your prioritization model and priority list should act as gatekeepers to moderate what makes it to the roadmap and what doesn't. This 3 step workflow is a safe way to a roadmap that is highly inclusive, efficient, and objective.
Now that you have a roadmap, the next task is to visualize it so that everyone understands. You want your roadmap to be clear to anyone in your organization; right from the various team members to your stakeholders, everyone should easily understand the roadmap and execute it. In short, your roadmap should be visually appealing, real-time-updated, and easily accessible to all members.
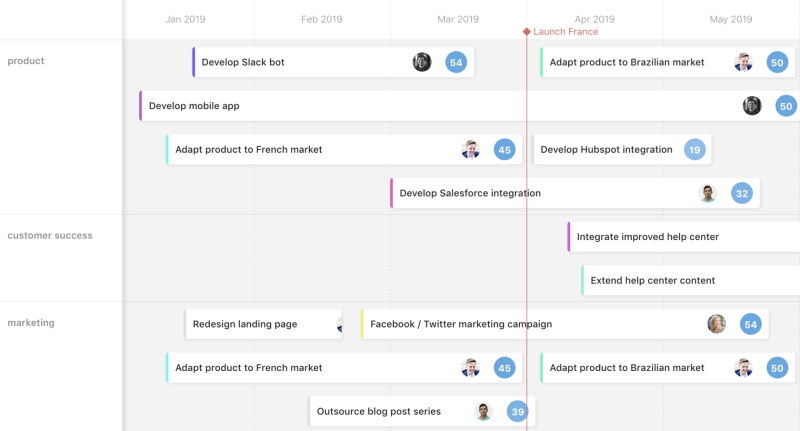
There are different ways to visualize and communicate your roadmaps, but the two most popular are the kanban view and the timeline Gantt chart.
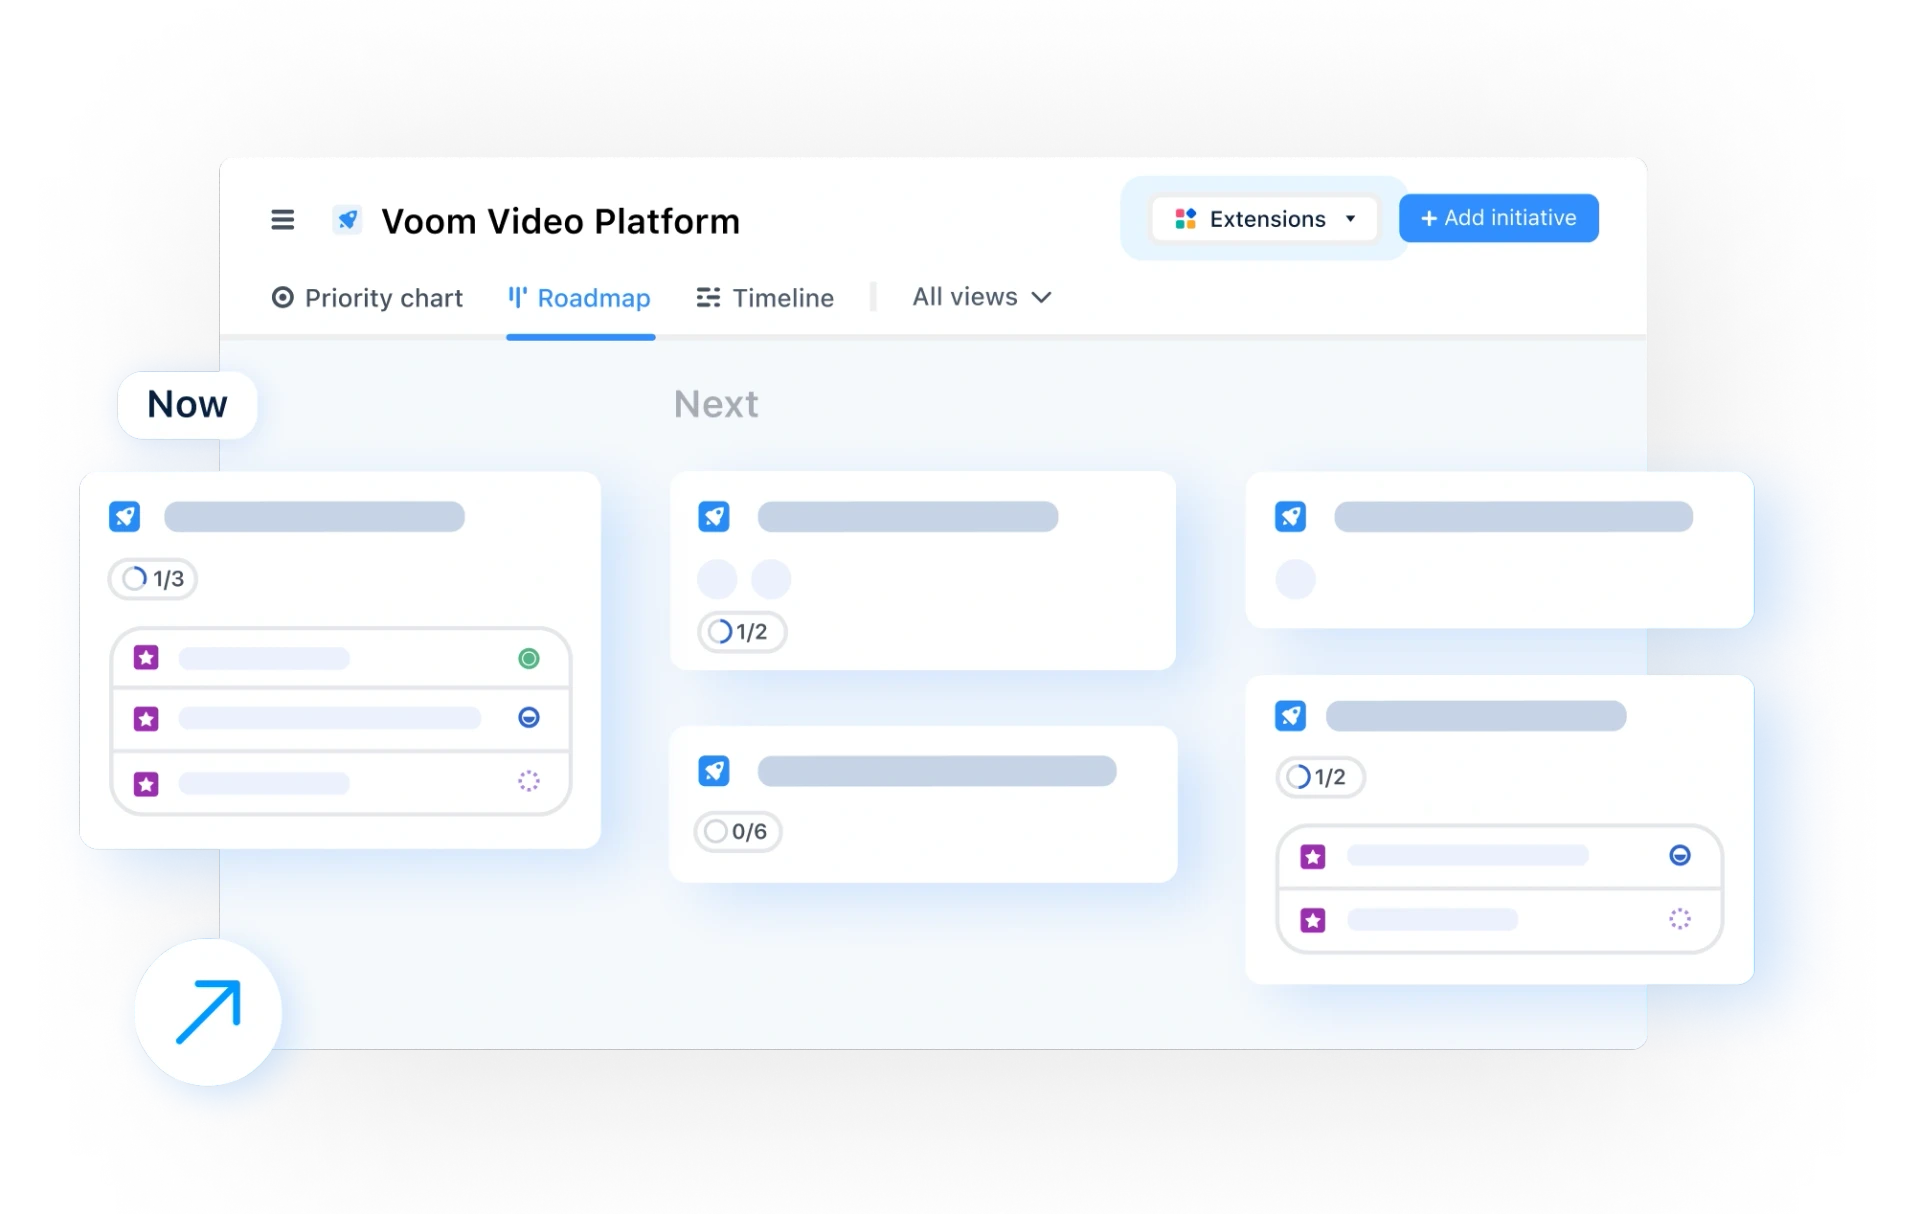
The kanban view lets you visualize your workflow according to clearly defined categories. This view is great to differentiate your tasks and projects by organizing them into customizable buckets. The most popular way to categorize projects is by differentiating them according to past (done), present (in progress), and future (to-do). Think of this as a bird's eye view for your entire product roadmap.
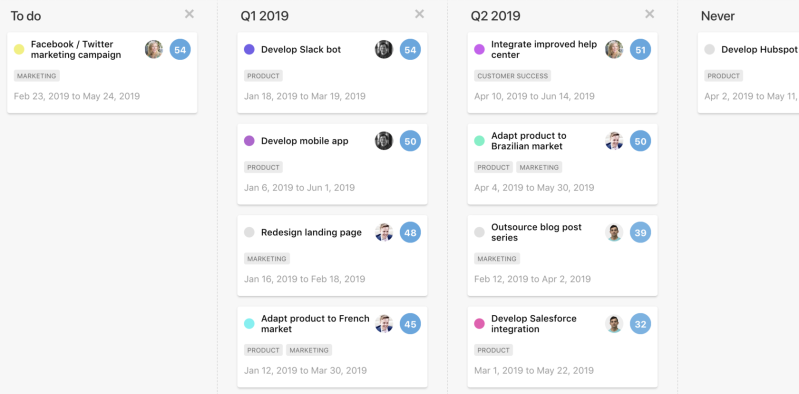
The timeline Gantt chart shows your items in a cascading order on a timeline, based on their start and finish date. This view is great to plan and track your project's progress and see your roadmap in relation to real-time work. See who is doing what and when while keeping a close eye on other projects and resources.
To conclude on these learnings, putting your focus on prioritization will get you lean, efficient, and more objective roadmaps. However, merely visualizing data does not ensure objectivity.
Put the airfocus prioritization scoring to test on your product. airfocus also integrates with all of your existing workflows and tools like Jira, Asana, and Trello so you can get started in minutes and have your content synced across all your tools.

Malte Scholz

Read also


Build great roadmaps
Experience the new way of doing product management
