Gantt Chart vs Kanban
What is Gantt Chart vs Kanban?
Gantt Chart vs Kanban
Gantt charts and Kanban boards are great visualization tools for displaying data, timelines, tasks, and more. Product teams often have difficulty choosing a visualization tool because both Gantt and Kanban have pros and cons. Let’s look at the difference between them so you can choose the best tool for your team.
What is a Gantt chart?
A Gantt chart visualizes tasks as bars that extend across a specific timeline. It’s well suited to project management and can respond to the specifics of software projects. With Gantt charts, software teams can quickly move through the fast-paced development process without losing track of key tasks.
What are the components of the Gantt chart?
Gantt charts are made up of nine components.
Dates - Dates are displayed along the top of the chart, showing when the project will begin, end, and when each task will take place.
Tasks - Tasks are listed down the left side to help you keep track of all of the sub-tasks in a project.
Bars - Bars show the time frame in which each task should be completed. This ensures that every sub-task is done on schedule.
Milestones - Milestones are tasks that are crucial to a project's completion and success. Milestones are displayed as diamonds (or, sometimes, a different shape) at the end of a particular taskbar.
Arrows - Arrows on a Gantt chart represent dependencies.
Taskbars - Taskbars show how far an individual task has progressed.
Vertical line marker - Vertical line markers indicate the current date on the chart.
Task ID - This helps people looking at the Gantt chart quickly understand which task they’re looking at.
Resources - Including resources on a Gantt chart is not required, but extremely helpful to keep limitations in mind.
Pros and cons of Gantt charts
Pros
Offers a realistic overview of a project's complexity
Saves time
Helps manage teams and resources
Cons
Becomes tougher to understand as project complexity increases
Not as simple to read compared to other visualization tools
Requires constant updates
What is a Kanban Board?
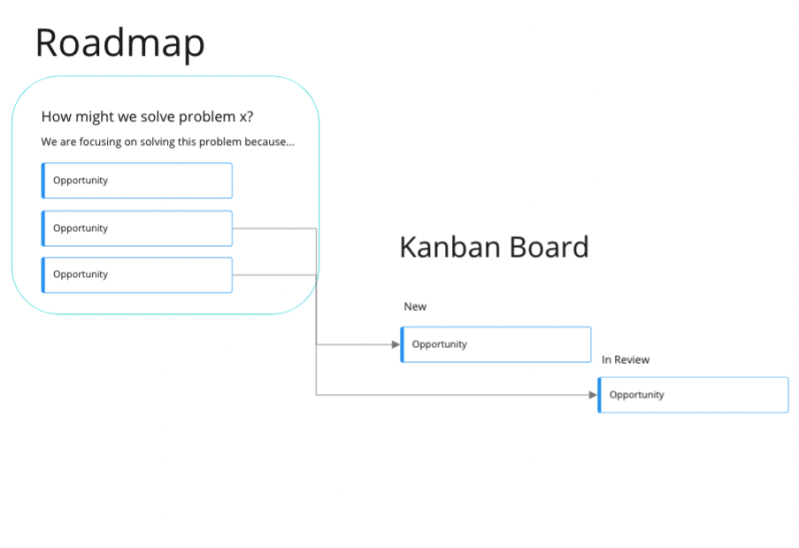
The Kanban Board is another visualization tool that lends itself to product management. Kanban boards offer a simple, streamlined layout that allows users to understand at a glance and make easy changes.
What are the components of a Kanban board?
The Kanban Board is much simpler to create than the Gantt chart, requiring just five steps.
Visual signals - Cards represent tasks on a Kanban board. These cards will contain text that concisely explains a task or item.
Columns - Kanban boards use a series of vertical columns representing different development stages. These columns usually represent the status of tasks, separated into “completed,” “in progress,” and “to-do.”
Work-in-progress limits - WIP limits help keep a Kanban board from becoming too busy. This helps maintain the at-a-glance readability of the document and stops the team from taking on too much work.
Commitment point - This is usually the “in progress” column, representing tasks that a developer has already committed to.
Delivery point - This is usually the “completed” column, representing tasks that have already been delivered.
Examples of Kanban boards

What are the pros and cons of kanban boards?
Pros
Simple enough for even product amateurs to understand
Easy to customize
Encourages collaboration
Cons
Less suited to fast-moving projects that change quickly
Kanban boards don’t focus on timeframes, which may be detrimental for a team working to deadlines
Needs to be updated regularly
Gantt Chart Vs. Kanban: what should you use for your project?
Both Gantt Charts and Kanban Boards are great ways to visualize the development process for a project. However, the two tools aren’t interchangeable and are suited to different projects.
Gantt charts are great for visualization tasks and dates to help teams track progress. This is useful for projects with strict deadlines or time-boxed activities. Projects with a defined scope and many dependencies can benefit from a Gantt chart because it can visualize the project's complexity with plenty of detail. They’re also great for sharing between parties outside of the project, which is why we see Gantt charts in various industries like construction, marketing, software development, and more.
Kanban boards are more simple, which is great for teams that need lots of flexibility. The board will show the status of tasks, which helps cross-functional teams better understand what is happening at any time. They’re also handy when combined with other methodologies, especially for Agile projects. You can create Kanban boards online for easy sharing or in person with a whiteboard or spare wall in the office.
Ultimately, the choice between a Gantt chart and a Kanban Board is up to you and your team. Use what you have learned here to identify the best fit for your team or project. You might even use a Gantt chart for one project and a Kanban board for the next!


Glossary categories
Experience the new way of doing product management

Experience the new way of doing product management


