KPIs in Product Management - How To Set, Measure and Track Them

Making your product measurable is one of the most important things to make your product successful.

“What gets measured gets attention.” This quote is often attributed to management guru Peter Drucker. However, what Drucker actually said was “If you can’t measure it, you can’t improve it.” Both quotes are two sides of the same coin.
If an aspect of your business is invisible, you don’t know how much it contributes to your success.
The business will focus on what it can measure to improve its performance. For a digital product, it is therefore critical to measure the right metrics that drive the product's success and, as a consequence, the business.

KPIs for Digital Products
KPI stands for Key Performance Indicator. A KPI is a metric that measures how your business is performing.
In a digital product, a good KPI measures an aspect of the product that is significantly contributing to the success of your business. A KPI does not have to be directly related to how you get revenue from your product, but often it will be. KPIs are used to enable businesses to make better decisions, and the same applies to digital product KPIs.
When you have determined the 3-5 right KPIs for your product, you will make better product decisions. Looking at the impact your planned product initiatives have on your KPIs should be a driver for all your product decisions and prioritisations. As ever in product management focus on the important stuff is key.
Defining KPIs for your product
OK, so KPIs are important.
Where do you start?
Firstly, think about the users that come to your product and ask yourself these questions:

What do you ideally like them to do? Buy your products, subscribe to your services, consume your content? What user behavior makes you money? Really thinking through this will uncover what the right KPIs are (some examples of good metrics for different types of products are given below).
Also, make sure that you whittle it down to no more than five. Having too many KPIs indicates a lack of clarity about what success means in your product. Once you have identified what the most important KPIs are, think about how you can influence each one. A KPI that you cannot influence is useless as you cannot base any decisions on it.
Contributing secondary metric
As KPIs are high-level metrics to describe your product it may not be obvious how you influence each KPI directly. But each KPI can have a number of contributing secondary metrics that are easier to influence.
For example, if you are an eCommerce business, you may want to have a KPI for conversion rate. Secondary metrics could be:
% of users viewing a product that adds it to the basket
% who click the checkout button in the basket
% who complete the checkout
There are many things you can do to improve each of these, but the KPI reported to the business remains the overall conversion rate.
Your KPIs may also change as your business matures.
For example, in a growth phase, a KPI may measure the acquisition of new customers. In a more mature phase, you may add retention of existing customers as they become more important to revenue.
KPI Examples for different business models
Below are some examples of common KPIs for different business models. eCommerce: This is quite a simple model. The sole purpose of your digital product is to sell products or services.

Subscription and SaaS products
Subscriptions and SaaS (Software as a Service) products are not identical, but they share the common characteristic that they focus on long-term customer retention in addition to sales.

User-generated content products This is one example of a business model where revenue is not as directly related to product KPIs. The KPIs are all about user engagement as that drives the revenue, usually from advertising. This type of business includes any product that relies on user contributions, e.g., social media, blog sites, etc.

For a more in-depth discussion of KPIs with different business models, the book Lean Analytics by Alistair Croll is a good read.
Avoid Vanity Metrics
A word of caution when defining KPIs: we have all seen graphs in meetings where a line with absolute numbers goes steadily up to the right. Everybody congratulates each other and feels good about it. These types of reports have their place in reporting business figures, but the use of absolute numbers in digital product KPIs are limited. There is a risk that they are vanity metrics.

Vanity metrics are metrics that grow without your influence and can therefore not be used for good decision-making. Take, for example, the number of visits or number of page views for a website. There are two problems with this type of metric: It will organically grow even without your product doing anything, simply by users accumulating on your site over time. It says very little about the actual success of the product. How do these visits or page views contribute to the success of your product? Do these users show any signs of giving you money? As you can see, these vanity metrics are not good KPIs as they don’t aid prioritization and decision-making. KPIs that use ratios rather than absolute numbers usually provide a clearer picture of success. Good examples for ratios are conversion rate, subscription rate, churn rate, etc.
KPI Reports and Dashboards

You have defined your product KPIs as outlined in our previous article.
Now what?
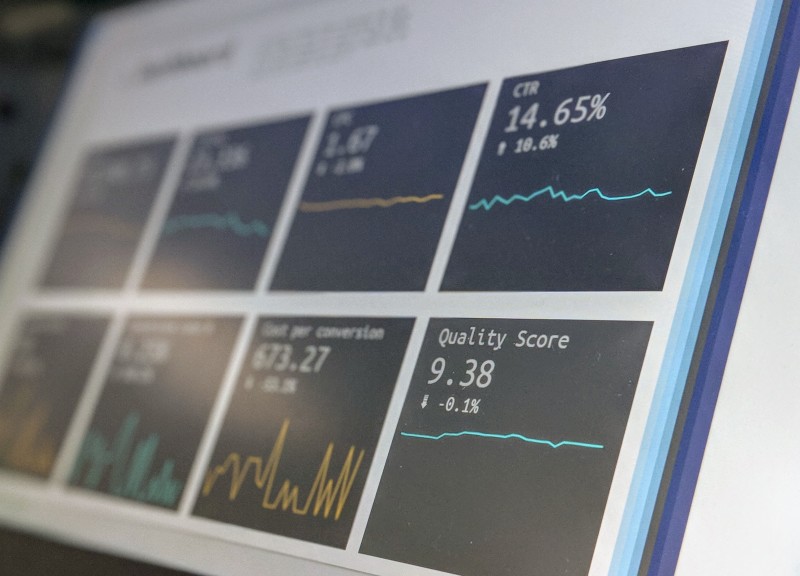
It’s time to gather all your data and create a cracking KPI report or even a KPI dashboard to monitor your product and keep your stakeholders in the loop.
Data Sources
Product data analytics should be a daily tool in your toolkit to make decisions and review the progress of your development. The KPIs are just a small subset of the analytics for your product, but they are what rolls it all up into a high-level picture. When you define your KPIs, you need to think about how you will actually get the data to measure them. Here are some possible data sources for your KPIs. Web analytics Web analytics products help you understand what users do on your website. Implementing a web analytics product can be as easy as including a little snippet of code. But don’t be fooled. Web analytics are only as meaningful as you make them. In their out-of-the-box implementation, web analytics products usually just track visits, visitors, and page views. To get good KPIs from web analytics, you will likely have to include more code into your product. Some examples are custom events to track certain steps in a flow or the value of a product a customer is viewing. Think ahead of what you would like to track and implement the analytics for every new feature and functionality. In this way, you will be able to track it from day one after rollout. Custom Product Database Analytics Database analytics are metrics you get from data that you store in your own systems. Your database is what your product and the business operate on. Some examples of such metrics may be products purchased or registered users. These numbers are generally very reliable. Database analytics are often better metrics for KPIs than web analytics. Database analytics reflect actual events that drive the business. Web behavior, on the other hand, may not result in value to the business at all. Data Warehouse Some companies use a separate data warehouse to store their business data. If possible, include your product data in the data warehouse, too. Including your product data has several advantages. You can link up your product data to other business data. You can analyze your KPIs using your company’s BI (Business Intelligence) tools. You can create nice visual dashboards using the BI tools.
Creating a KPI report or dashboard
You have all your data lined up; now it is time to report it in an easy-to-understand and efficient way. It is good practice to have no more than five product KPIs. This means that you really focus on the most important metrics. There is even a school of thought that you should just have one North Star Metric! Therefore your KPI report or dashboard needs to be concise. Consider these important points to shape it: Anybody looking at your report should understand at a glance how things are going. Try to convey positive or negative trends visually (e.g., by color-coding). Your readers need to understand what your numbers actually mean. If that is not immediately obvious to everyone across the business, include some explanations. If possible, use weekly numbers. This allows you an almost real-time view of how your product is performing. A comparison view to previous periods is important, for example, WoW (week over week) or MoM (month over month) changes. If you have strong seasonality in your product, a YoY (year over year) comparison may be the most meaningful. A simple shared document may do for your report. If your company uses a BI tool, you can also create a KPI dashboard or KPI scorecard. This allows users to see your data at a glance, but they can also drill deeper if they want.

If possible, automate the gathering and creation of the weekly report. And don’t forget your secondary metrics that support your KPIs. We have discussed these also in our article about KPIs in Product Management. The secondary metrics can be included in your KPI dashboard too, but there must be a clear distinction to the actual top-level KPIs.
Spread the Word
Your KPI dashboard should be open to anyone who would like to see it. Businesses love numbers. Your stakeholders will love your KPI dashboard. Ideally, you want your KPIs to be read by every stakeholder. Therefore you need to spread the word as widely as possible.

Monitoring how your product performs gives stakeholders confidence and builds trust in you and your product. If everybody sees your numbers weekly, there are no surprises. You and your stakeholders are always on the same page about the current state. This can help greatly when you have your prioritization sessions.
Conclusion
If you define relevant KPIs and create a good KPI report, it will help you in many ways to do a good job as a Product Manager. You will
always know how your product is performing
make better product decisions
build trust and confidence with your stakeholders
have better prioritization conversations with your stakeholders
So what next? KPIs are one of the most important tools in your toolkit for making good product decisions. Basing the prioritization of your roadmap on well-understood and agreed KPIs yields better results than assessing the impact on gut instinct, so that is a good place to start.

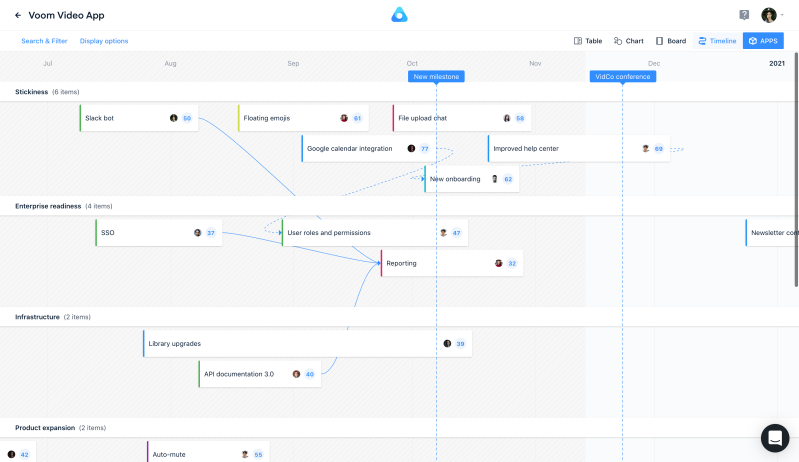
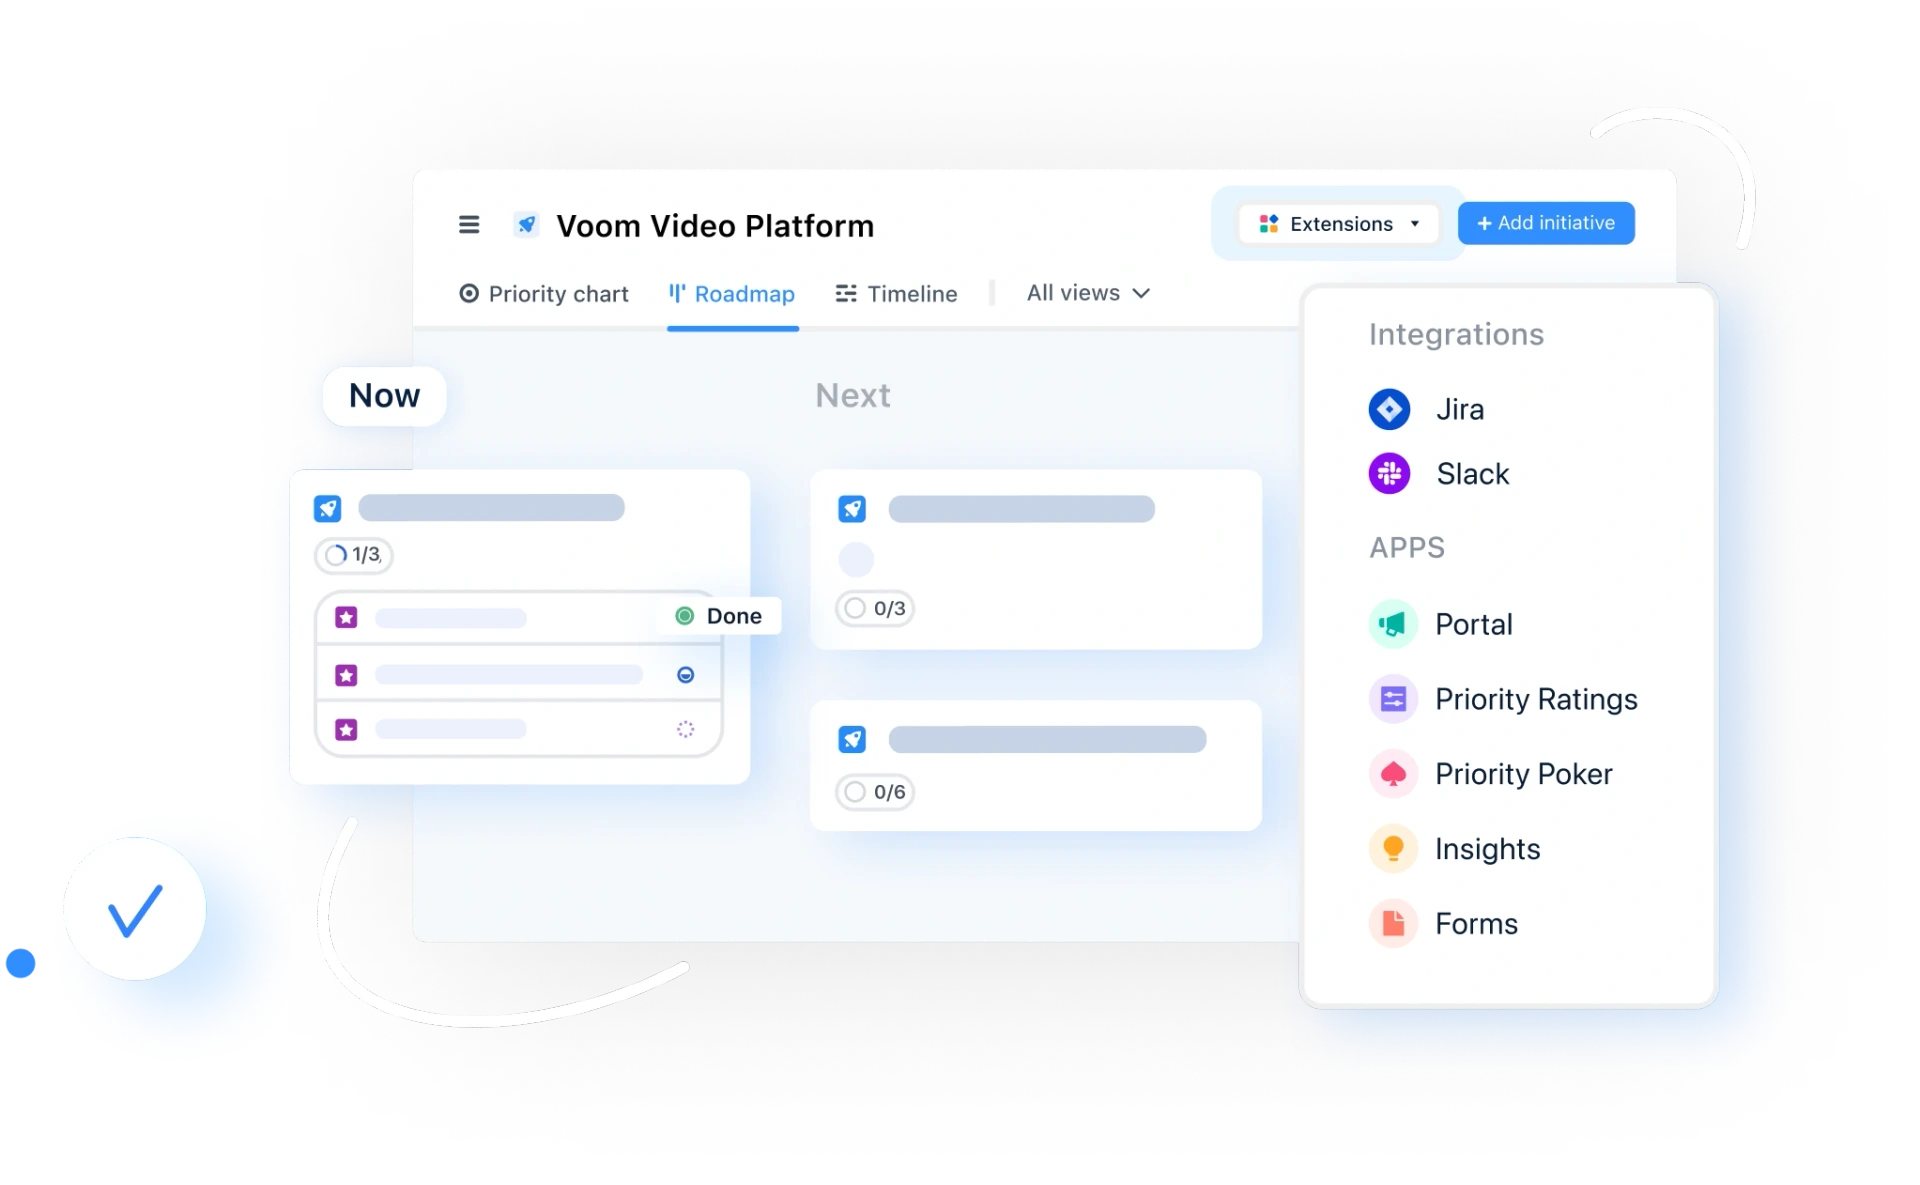
If you want to take full advantage of your planning sessions, you can use a prioritization tool like airfocus with a built-in prioritization matrix. airfocus enables you to visually map out your priorities on a chart and transform your priorities into an actionable roadmap at the click of a button.

Kerstin Exner

Read also


Experience the new way of doing product management

Experience the new way of doing product management


